Here’s what must be true: vending machine logistics determines your profit before a single customer buys a single snack.
Most new operators obsess over Coca-Cola versus Pepsi, or whether Snickers outsells Twix. They spend weeks researching product margins and negotiating supplier contracts. Meanwhile, they’re routing themselves into bankruptcy with inefficient service schedules and scattered machine placements.
The vending industry has a dirty secret—product selection accounts for roughly 15-20% of your operational success, while route density, service frequency, and distribution efficiency account for the other 80-85%. You’re not in the snack business. You’re in the business of moving inventory from warehouse to machine as efficiently as possible, then doing it again tomorrow.
This article breaks down the three core pillars of vending machine logistics that separate profitable operators from those grinding toward failure. Understanding these systems doesn’t just improve your business—it fundamentally changes what business you think you’re in.
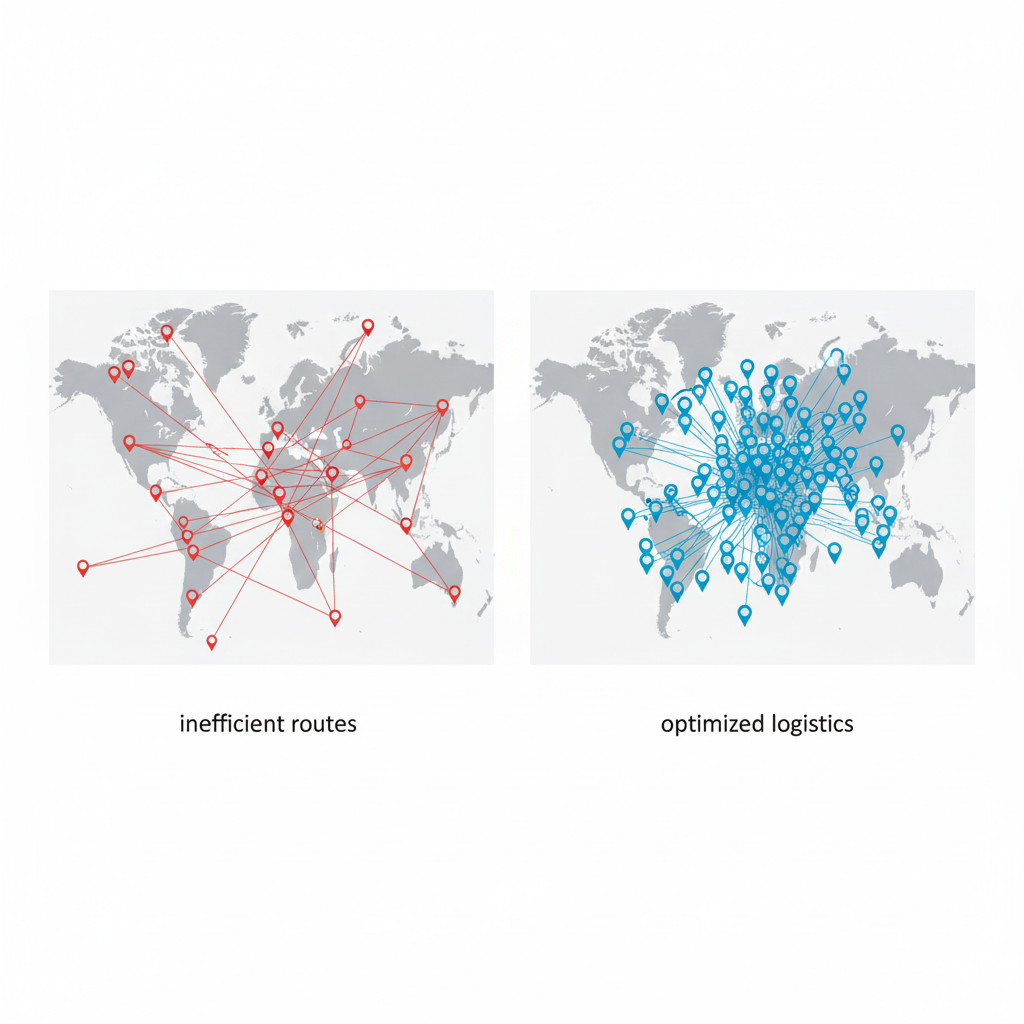
Route density is the concentration of your machines within a defined geographic area. High route density means your machines cluster together; low density means they’re scattered across town or multiple towns.
Here’s the math that matters: A technician driving 5 miles between 10 machines burns 50 miles. A technician driving 0.5 miles between those same 10 machines burns 5 miles. That’s a 90% reduction in drive time, fuel cost, and vehicle wear.
According to industry data from Vending Market Watch, the average vending operator services 15-30 machines per route, with service times ranging from 15-45 minutes per machine depending on complexity. When machines are geographically clustered, operators can service 20-25 machines in an 8-hour shift. When machines are scattered, that number drops to 10-15 machines.
“Route density isn’t about convenience—it’s about whether your labor costs allow you to stay in business.”
The density multiplier effect: Every mile of separation between machines doesn’t just add drive time—it multiplies your cost structure across every service visit for the lifetime of that machine placement. A machine 10 miles from your route center costs you 20 miles round-trip, every single service visit, forever.
What happens when you accept a location because “it’s a good account” but it’s 15 miles outside your service area? You’ve just committed to thousands of dollars in additional logistics costs over the machine’s lifetime. The snack margins don’t matter if the route economics fail.
Consider this: How much extra weekly revenue would a single remote location need to generate to justify the additional 30 miles per service visit?
Service frequency in vending machine logistics refers to how often you visit each machine. Most operators think this is dictated by sales volume—high-volume machines get serviced more often, low-volume machines less often.
Wrong.
Service frequency should be optimized for route efficiency and labor utilization, not individual machine performance. The question isn’t “when does this machine need service?” The question is “how do I batch service visits to maximize stops per labor hour?”
Research from the National Automatic Merchandising Association (NAMA) shows that service costs (labor, fuel, vehicle maintenance) typically represent 25-35% of gross revenue for vending operations. Operators who optimize service frequency based on route batching rather than individual machine needs reduce these costs by 15-20%.
Here’s what this looks like operationally:
Inefficient approach: Service machines individually when inventory alerts trigger, resulting in 2-3 trips per week to different parts of your territory.
Logistics-optimized approach: Batch all machines in a geographic cluster into a single service day, even if some machines haven’t hit minimum inventory thresholds. Service slightly early on some machines to maintain route consistency.
The math: If you’re making three separate trips to service machines in the same area on Monday, Wednesday, and Friday, you’re tripling your drive time. Batching those machines into a single Wednesday service run cuts your logistics costs by 66% for that cluster.
“Service frequency optimization isn’t about reacting to sales—it’s about designing operational tempo that minimizes cost per transaction.”
The operational question: Are you scheduling routes around efficient batching, or are you reacting to individual machine alerts and destroying your labor economics in the process?
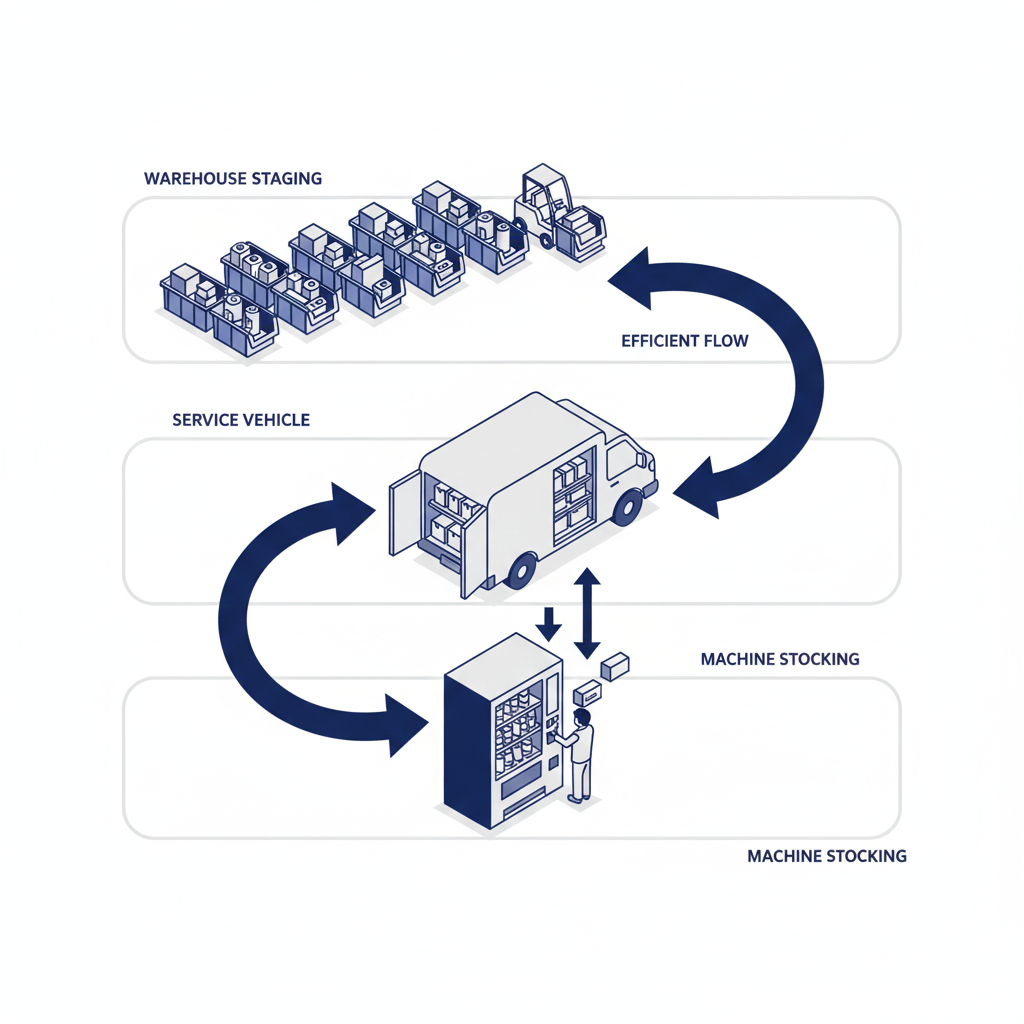
Distribution efficiency in vending machine logistics means minimizing the total system cost of moving products from your supplier to the customer. This includes warehouse receiving, inventory staging, vehicle loading, machine stocking, and empty product removal.
Most operators think distribution is simple: Buy products, put them in the van, drive to machines, stock machines. But every inefficiency in this chain multiplies across every product movement, every service visit, forever.
According to data from the Convenience Distribution Association, optimized warehouse staging and vehicle pre-loading can reduce service time per machine by 20-30%. For an operator servicing 20 machines per day, this represents 1.5-2.5 additional machine services possible in the same shift—a 10-12% capacity increase with zero additional labor cost.
The components of distribution efficiency:
Warehouse staging: Products organized by route and service day, not by product category. Your warehouse layout should mirror your service schedule.
Vehicle pre-loading: Vans loaded the night before with exact route inventory, eliminating morning prep time and reducing decision fatigue during service.
Machine stocking sequences: Standardized top-to-bottom, left-to-right stocking patterns that reduce cognitive load and minimize stocking errors.
Reverse logistics: Efficient removal of empty boxes, damaged products, and coins during the same service visit that delivers new inventory.
Each of these components seems minor in isolation. Together, they compound into substantial operational advantages.
Product selection matters—just not as much as vending operators think it does.
The reality: Once you stock the proven staples (Coca-Cola, Pepsi, Snickers, Lays, etc.), you’ve covered 70-80% of customer demand regardless of location. The remaining 20-30% of inventory optimization provides marginal returns compared to logistics optimization.
Industry sales data from IRI and Nielsen consistently shows that the top 20 SKUs account for approximately 65-75% of vending sales across most locations. This means the difference between good and great product selection is relevant, but it’s not the primary profit driver.
Compare this to logistics optimization:
Meanwhile, the difference between “good” and “excellent” product selection might improve revenue by 8-12%.
The math is clear: Get logistics right first, then optimize products. Most operators do the opposite—they obsess over snack varieties while ignoring the fact that they’re burning $200 in fuel per week to service machines that could be batched into tighter routes.
“Perfect product selection in poorly optimized routes still loses to average product selection in highly efficient logistics.”
This doesn’t mean product selection is unimportant. It means understanding where to invest your optimization energy. New operators should spend 80% of their strategic thinking on logistics and 20% on products, not the reverse.
Here’s what happens when operators focus on products instead of vending machine logistics:
Stage 1: New operator accepts scattered machine placements because “every location is revenue.” They’re excited about building their machine count.
Stage 2: Service costs begin eating into margins. The operator notices they’re working harder but profit isn’t scaling proportionally.
Stage 3: To compensate for high logistics costs, the operator tries to boost revenue through premium product placement or aggressive pricing—neither of which solves the underlying route inefficiency.
Stage 4: The operator burns out from excessive drive time and inefficient service schedules. They’re working 60-hour weeks but barely breaking even.
Stage 5: The business fails or the operator sells out at a loss, blaming “low margins” or “competitive markets” when the real problem was always logistics.
This death spiral is preventable. The operators who survive and thrive are the ones who recognize early that vending is fundamentally a logistics optimization problem.
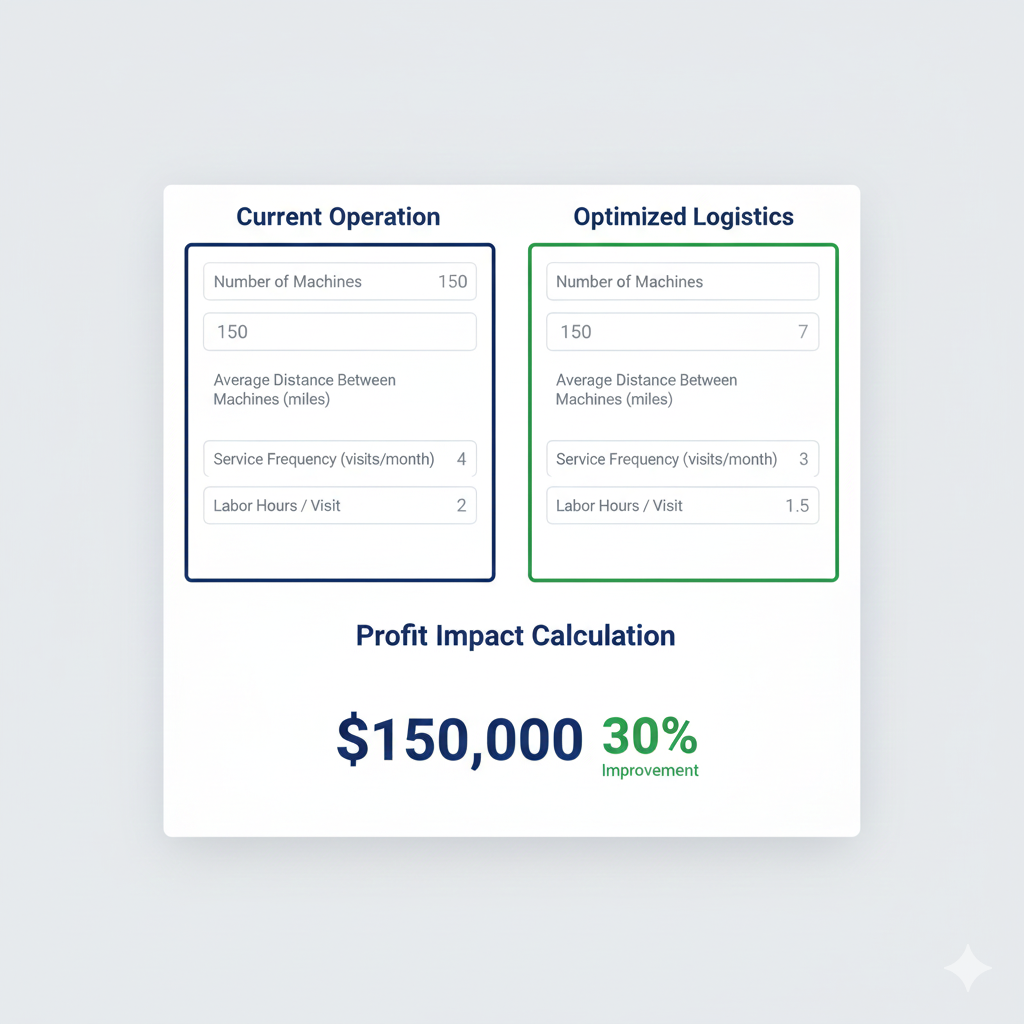
Consider this scenario: Two operators each have 30 machines generating $500/month revenue per machine.
Both generate $15,000/month in revenue. Operator A nets $3,000 after logistics costs. Operator B nets $6,500. Same revenue, double the profit—the difference is logistics.
Step 1: Audit Your Current Route Density
Target metric: Average distance between machines should be under 3 miles for profitable operations.
Step 2: Establish Geographic Service Boundaries
Implementation: Before accepting any new location, calculate the round-trip mileage and multiply by expected annual service visits. If that total exceeds $500-800 in fuel costs alone, reject the location unless revenue is exceptional.
Step 3: Redesign Service Schedule for Batching
Example: Monday = North Zone (all 12 machines), Wednesday = Central Zone (all 15 machines), Friday = South Zone (all 10 machines).
Step 4: Optimize Warehouse Staging
Step 5: Calculate Your True Cost Per Machine
Include:
Target metric: Total logistics cost per machine per visit should be under 25-30% of that machine’s monthly revenue for sustainable operations.
Step 6: Implement a Location Rejection Framework
Create a scorecard for evaluating new locations:
Rule: Reject 60-70% of potential new locations based on logistics factors, even if the location “seems good.”
Understanding that vending is a logistics business changes everything. You stop evaluating locations based on foot traffic and start evaluating them based on route integration. You stop chasing high-margin specialty products and start optimizing service batching. You stop thinking like a retailer and start thinking like a distribution company.
This shift is uncomfortable. It means saying no to “good opportunities” that destroy your route density. It means accepting that a slightly lower-revenue location that fits perfectly into your existing route is better than a higher-revenue location that requires a 20-mile detour.
But this shift is also liberating. Once you see vending machine logistics as the primary profit driver, you can stop guessing about products and start engineering systems. You can build actual, scalable operations instead of managing chaos.
The final question: Are you building a logistics company that happens to sell snacks, or a snack company drowning in logistics costs?
The answer determines whether you build wealth or work yourself to death.
Learn more about optimizing for logistics here:
Top 5 Maryland Vending Machine Drinks That Drive Sales
Top 5 Snack Items in Maryland Vending Machines
Smart Cooler Energy Costs vs Traditional Refrigeration: The Thermal Economics
Route Density In Vending: The Hidden Costs That Harm Operators