
Most operators place their first vending machine where opportunity appears, then spend months discovering why it doesn’t work. This is expensive education. The alternative is compressing years of trial-and-error into front-loaded intelligence frameworks that make your first placement already optimized.
The difference isn’t luck. It’s pre-positioning your understanding of the variables that determine machine performance before capital is deployed.
The conventional path follows a predictable pattern: secure a location that seems promising, install equipment, stock products based on assumptions, then react to poor performance with iterative adjustments. Each adjustment reveals what should have been discovered before placement.
Industry data shows 68% of first-time vending operators report their initial location underperformed expectations, with 43% relocating within the first year. The average cost of this education: $3,200 in lost revenue and relocation expenses during the learning period.
The expensive way to learn vending is discovering foot traffic patterns don’t match demographic assumptions after you’ve signed a twelve-month location agreement.
This failure mode isn’t operator incompetence—it’s systems blindness. Without frameworks for evaluating the seven variables that determine machine performance, decision-making defaults to surface-level indicators: building size, friendly property managers, visible foot traffic. These matter, but they’re insufficient predictors of first vending machine placement success without deeper operational context.
What separates optimized first placements from educational failures? Pre-launch intelligence collection that answers specific performance questions before equipment deployment.
Experienced operators develop pattern recognition through accumulated failures. They learn which location characteristics predict high turnover, which demographics drive specific product preferences, which service route configurations make small accounts profitable. This knowledge base typically requires 18-24 months and multiple machine placements to develop.
The intelligence inversion compresses this timeline by studying the variables before placement instead of discovering them through performance deficits.
Consider route density economics—a concept most operators encounter only after realizing their single machine requires the same service visit cost as five machines clustered within two miles. The experienced operator recognizes this constraint during site evaluation. The learning operator discovers it when calculating per-visit profitability six months post-installation.
Front-loading this intelligence means building decision frameworks that incorporate:
This isn’t research paralysis—it’s strategic data collection that takes 15-20 hours of focused work but prevents months of reactive optimization.
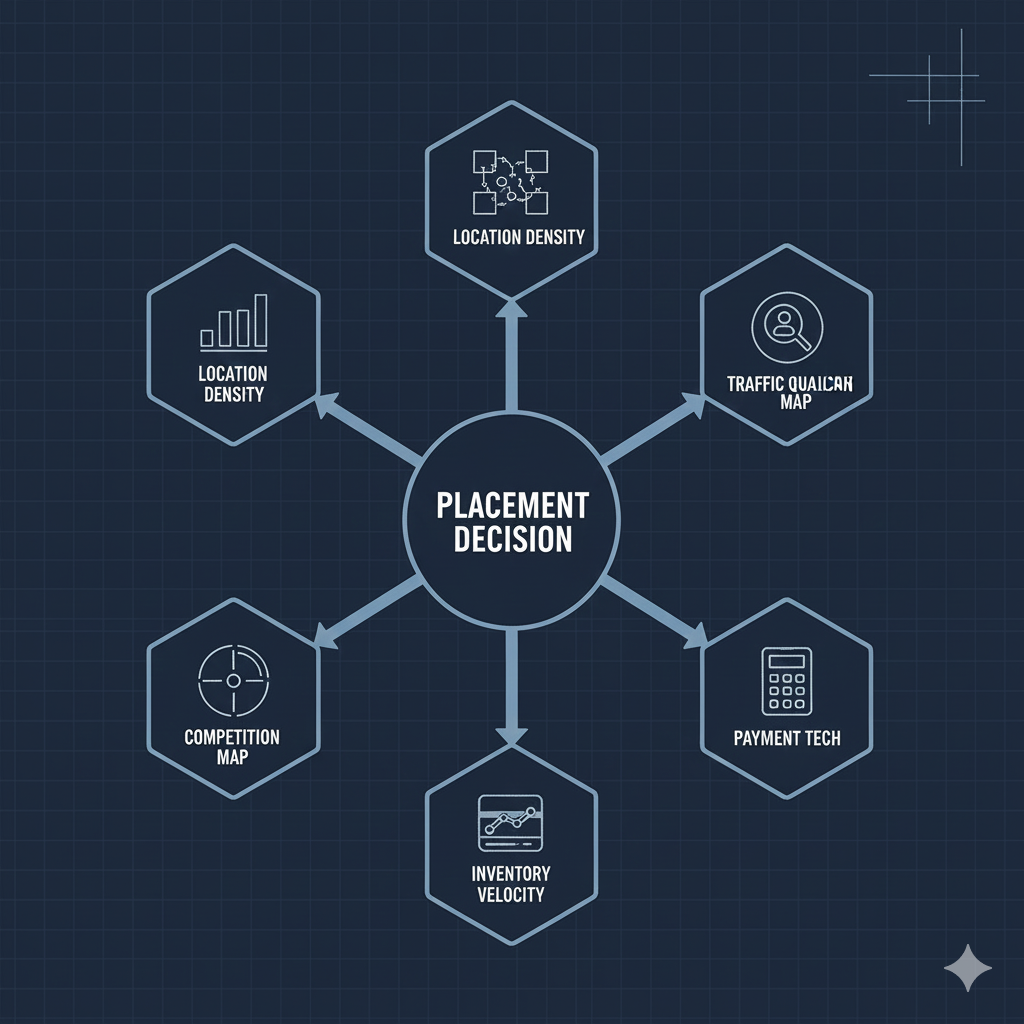
Every first vending machine placement decision compresses into seven measurable variables. Experienced operators evaluate all seven before committing. Learning operators discover their importance sequentially through underperformance.
1. Location Density Potential
Not just current foot traffic, but capacity for additional machines within a two-mile service radius. A successful first placement should enable route density development, not exist as an isolated outpost requiring dedicated service trips.
Research from the Automatic Merchandiser 2024 State of the Industry report indicates operators with route density above 8 machines per service area achieve 34% higher profit margins than those servicing dispersed single-location accounts.
2. Demographic-Product Alignment
Product mix performance varies dramatically by location demographics. Office buildings with professional workers ages 25-45 show 72% higher sales for premium snacks and cold beverages compared to industrial facilities with shift workers preferring traditional candy and salty snacks.
Your first machine product selection should reflect documented consumption patterns for your specific demographic, not generic vending assumptions.
3. Foot Traffic Qualified Volume
Raw traffic counts mislead without qualification. A facility with 200 daily visitors who pass your machine location twice (400 traffic instances) performs differently than 200 unique visitors who pass once.
Traffic qualification metrics include:
Foot traffic without purchase context is vanity data. Qualified traffic that intersects with consumption moments is operational intelligence.
4. Competition Mapping
Understanding competitive radius—not just immediate building competition, but alternative purchase options within walking distance—prevents placement in over-served markets.
Map all vending machines, convenience stores, cafeterias, and food trucks within 500 feet. Calculate per-capita vending availability: fewer than one machine per 100 people indicates opportunity; more than one machine per 50 people suggests market saturation.
5. Service Route Economics
Your first placement establishes your service route baseline. A profitable single machine in isolation is irrelevant if the location prevents future route density development.
Calculate realistic service costs: vehicle expenses, time allocation, inventory handling. For most operators, break-even service efficiency requires minimum $200 weekly revenue per stop when accounting for fully loaded visit costs.
6. Payment Technology Adoption
Cashless payment penetration varies by demographics and location type. Professional office environments show 85-90% cashless transaction rates, while industrial facilities may see 60-65% rates.
Your technology investment (cashless readers, smart cooler connectivity) should match documented adoption patterns for your first vending machine placement demographic, not aspirational industry trends.
7. Inventory Turnover Velocity
Product turnover directly impacts capital efficiency and spoilage risk. High-turnover locations (3+ turns per week) enable tighter inventory management and fresher products. Low-turnover scenarios (less than 1 turn per week) create capital drag and require different product selection strategies.
Pre-launch research should establish realistic turnover expectations based on comparable locations, not hopeful projections.
Intelligence frameworks prevent decision-making based on incomplete information. Before committing to your first vending machine placement, construct these three analytical layers:
Data collection timeline: 5-7 hours
Spend one full week observing your target location across different days and times. Document:
Photograph traffic flow at peak times. Count unique individuals, not total passages. Note purchase behaviors at existing machines or nearby retail.
Data collection timeline: 3-4 hours
Map all vending and food service within a half-mile radius. For each competitor, record:
Calculate market density: Total vending machines ÷ Total building population = machines per capita ratio. Ratios above 1:75 indicate competitive saturation.
Data collection timeline: 4-5 hours
Model your service route economics before equipment purchase. Calculate:
Base service cost per visit:
Break-even analysis:
For most operators, single-machine routes require $175-$225 weekly revenue minimum to justify dedicated service trips. Below this threshold, placement only makes sense as part of future route density development.
Don’t optimize your first machine in isolation. Optimize your first service route, which happens to contain one machine initially but enables five within eighteen months.
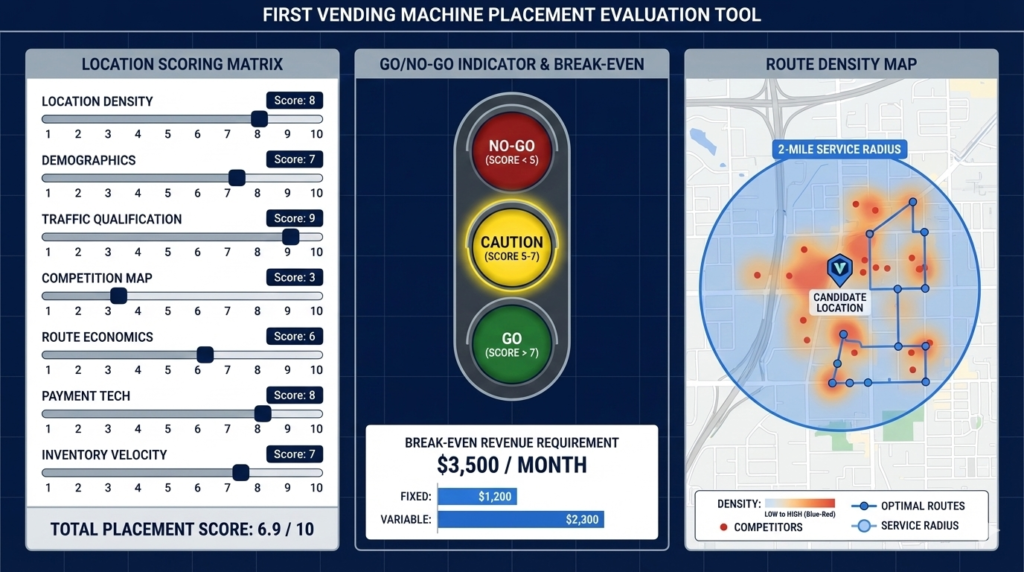
Combine all three intelligence layers into a scoring framework:
Go/No-Go Criteria:
This isn’t arbitrary scoring—it’s forced confrontation with incomplete information before capital deployment.
As you develop your intelligence framework, these questions separate surface-level evaluation from operational analysis:
For location density: If this location succeeds, can I place four more machines within the same service route over the next year? If not, am I accepting single-machine service economics permanently?
For demographics: Do I have documented evidence of product preferences for this specific population type, or am I making assumptions based on what seems popular?
For traffic qualification: Have I observed actual purchase behaviors and timing patterns, or am I estimating based on building occupancy numbers?
The difference between optimized and educational first placements often reduces to whether you answered these questions with data or assumptions.
Week 1: Location Intelligence Development
Week 2: Competitive and Route Analysis
Week 3: Decision Framework Application
Your first vending machine placement isn’t about finding the perfect location—it’s about developing the intelligence framework that makes every subsequent decision incrementally better.
Most operators spend $3,200 learning what could be discovered in twenty hours of focused research. The choice isn’t between action and paralysis. It’s between front-loading the hard thinking or financing it through underperformance.
The machine you place second will be smarter than your first. The question is whether your first already contains the intelligence most operators develop by their third.
Here are some resources that helped me optimize this process:
Top 3 Ways to Get Vending Machine Clients in 2026
How I Landed My First Location With Zero Proof