Every vending machine sits in a stream of human traffic. People walk past. Some stop. Fewer buy. This ratio—vending machine conversion rate—is the difference between a profitable location and a cash drain that bleeds $200/month in service costs against $150 in revenue.
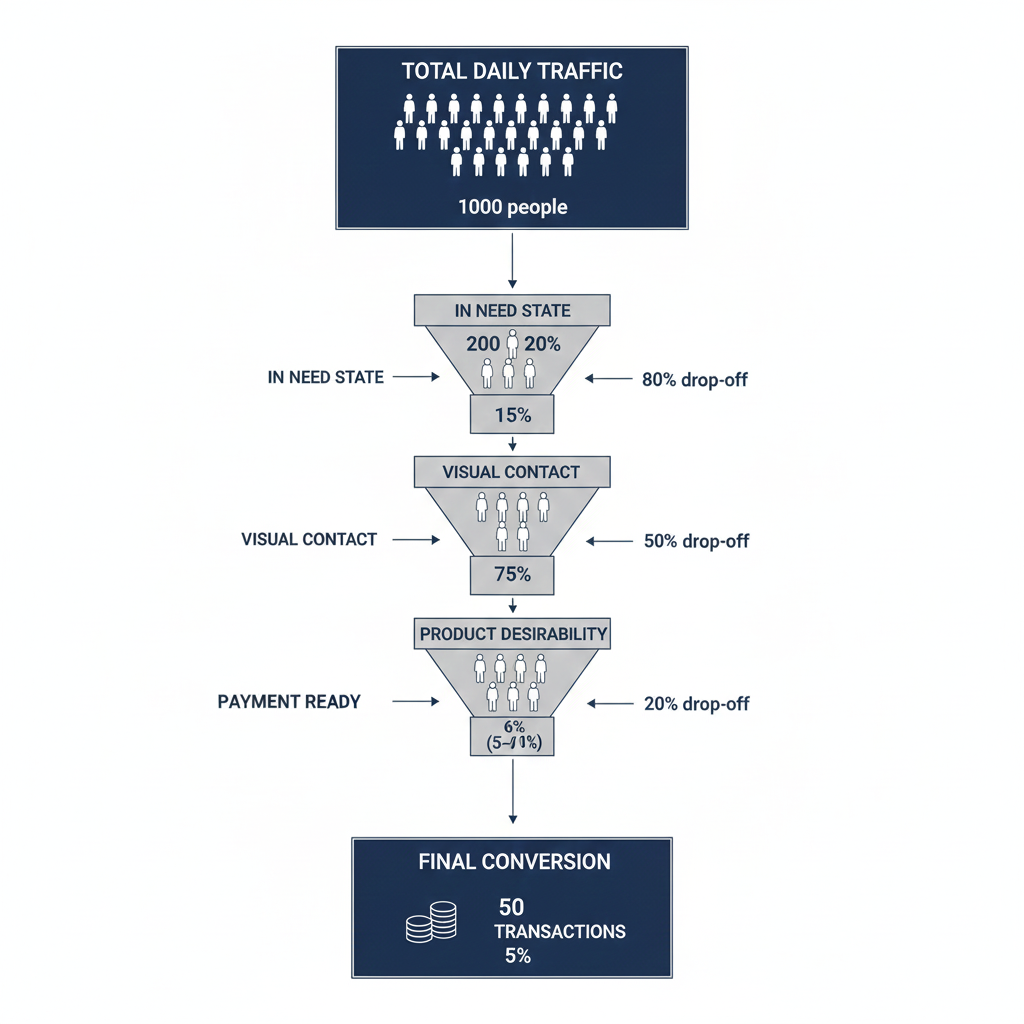
Industry data shows the average vending machine conversion rate ranges from 2% to 12% depending on location type, with the median hovering around 5-6%. This means for every 100 people who pass within visual range of your machine, 5-6 will complete a transaction. The other 94-95 are invisible revenue you’re not capturing—or traffic that was never convertible in the first place.
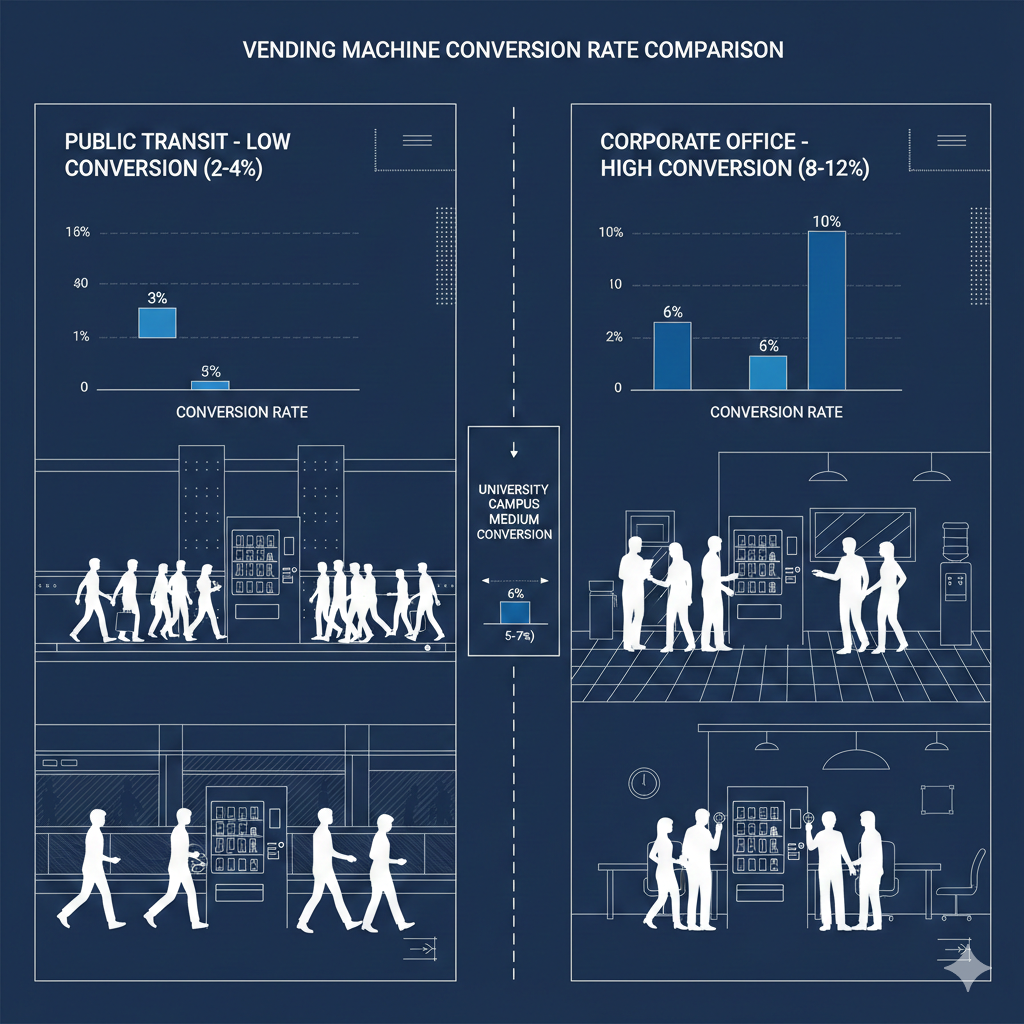
Most operators obsess over foot traffic counts. They chase high-traffic locations, believing volume solves all problems. But a machine in a transit station seeing 5,000 daily passersby at 2% conversion (100 transactions) will underperform a corporate breakroom with 500 daily passersby at 10% conversion (50 transactions) when you factor in transaction value and service costs.
The question isn’t “how many people walk past”—it’s “what percentage of qualified traffic converts, and why?”
A 2023 industry analysis of over 12,000 vending machines across multiple location types established baseline vending machine conversion rate ranges:
High-Conversion Environments (8-12%):
Medium-Conversion Environments (4-7%):
Low-Conversion Environments (2-4%):
The differential isn’t random. It’s structural. Vending machine conversion rates correlate directly with three mechanical factors: captive duration, alternative proximity, and cognitive friction.
1. Captive Duration
How long is someone trapped in proximity to your machine? An office worker on a 15-minute break has 900 seconds to consider a purchase. A transit passenger waiting 6 minutes has 360 seconds. A pedestrian walking past has 3-8 seconds of visual contact.
Conversion follows dwell time with brutal precision. Research from the National Automatic Merchandising Association shows that locations where people spend 10+ minutes in proximity see conversion rates 3-4x higher than locations with sub-60-second exposure.
2. Alternative Proximity
What else is within a 90-second walk? A vending machine 30 feet from a Starbucks competes with a $6 latte in a branded cup. The same machine in a factory breakroom 400 feet from the nearest exit is a monopoly.
Data from operators tracking competitive density shows each additional food option within a 2-minute walk reduces vending conversion by an average of 15-25%. This isn’t about better products—it’s about cognitive switching costs. The brain defaults to the known purchase pattern.
3. Cognitive Friction
How many decision points exist between “I’m hungry” and “I’m holding a product”? Modern cashless payment has increased conversion by 15-30% in locations that previously required exact change. Payment friction is a conversion killer—but so is selection paralysis.
Machines offering 40+ SKUs see lower conversion than machines with 20-25 strategic options in high-decision-friction environments. The brain treats selection as work. When cognitive energy is limited (transit commute, between meetings), fewer choices convert better.
Here’s what operators miss: most people walking past your machine are not in your addressable market. They’re not thirsty. They’re not hungry. They don’t have $2. They’re late for something. They already ate.
The vending machine conversion rate you should care about isn’t “% of all passersby”—it’s “% of qualified need-state traffic.”
A study of workplace vending found that while overall conversion hovered at 8%, conversion among people who had explicitly stated they were hungry or thirsty in the prior 15 minutes was 42%. The gap between 8% and 42% represents everyone who walked past without an active need state.
This matters because it reframes optimization. You can’t convert someone who isn’t hungry. You can only:
Low vending machine conversion rates don’t just mean lost revenue—they mean structural unprofitability. Here’s the math:
Scenario A: High-Traffic, Low-Conversion
Scenario B: Medium-Traffic, High-Conversion
Revenue is nearly identical. But Scenario A requires:
Scenario B generates the same revenue with 60% less service burden. Vending machine conversion rate efficiency is the difference between a machine that demands weekly service and one that runs on bi-weekly routes.
Low conversion doesn’t just reduce revenue—it multiplies every operational cost against a smaller revenue base until the location becomes a strategic liability. That’s why location is often touted as the most important variable in a successful vending buisiness, learn how I am preparing for my 1st machine placement here: Why My First Machine Will Already Be Optimized in 2026
Most operators don’t know their conversion rate because they don’t track the right inputs. Here’s the operational framework:
Method 1: Transaction Counter + Traffic Camera
Method 2: Time-Boxed Observation
Method 3: Comparative Location Analysis
The goal isn’t perfect precision—it’s directional intelligence. If you discover your corporate breakroom machine converts at 11% while your lobby machine converts at 4%, you’ve identified a structural problem worth solving.
Based on aggregated industry data and operator reporting:
Acceptable Baselines by Location Type:
If your machine is performing 30%+ below these baselines, you have a conversion problem—not a traffic problem. The solution isn’t finding more people. It’s converting more of the people already walking past.
Improving vending machine conversion rates follows a diagnostic cascade:
Stage 1: Visibility Optimization
Does your target customer see the machine from their natural path? A machine tucked around a corner or behind a door converts 40-60% lower than one with direct sightline from primary traffic flow. Visibility is permission to consider purchase.
Stage 2: Friction Reduction
Every barrier between impulse and transaction reduces conversion:
Data from cashless retrofits shows 20-35% conversion increases post-installation. The cognitive cost of “do I have exact change?” eliminates purchase intent before need state can translate to action.
Stage 3: Need State Triggering
Strategic placement can create need states that don’t exist:
The best locations don’t just intercept existing need—they generate it through environmental cues.
Stage 4: Product-Market Fit
Your conversion rate is capped by how well your inventory matches actual demand. A machine stocked with healthy snacks in a manufacturing facility will underperform one with traditional high-calorie options. The workforce isn’t wrong—your product strategy is.
Operators who track SKU-level performance and ruthlessly eliminate bottom performers see 10-15% conversion improvements without changing locations. The machine becomes a tighter fit for the actual customer.

1. Establish Your Baseline (Week 1-2)
Conduct manual observation or install simple traffic counters at your top 3 performing locations and bottom 3 performing locations. Track total passersby, examination stops, and completed transactions for 14 days. Calculate conversion rate for each location.
2. Identify Conversion Gaps (Week 3)
Compare your actual conversion rates to the industry benchmarks for your location type. Any machine performing 30%+ below benchmark has a fixable problem. Categorize issues: visibility (can’t see it), friction (payment barriers), or product-market fit (wrong inventory for customer).
3. Implement Highest-Leverage Fix (Week 4-6)
If conversion is <5% in a corporate environment, cashless payment is likely your constraint. If >8% but transactions are low, you have a traffic problem not a conversion problem. If conversion varies wildly between similar locations, examine product mix differences and standardize top performers.
4. Track SKU-Level Performance (Ongoing)
For machines with conversion >8%, optimization shifts to transaction value. Identify which products drive highest dollar-per-transaction and which generate highest unit velocity. Eliminate bottom 20% of SKUs by both metrics and replace with proven performers from other locations.
5. Build Route Intelligence (Month 2-3)
Once you know conversion rates by location type, you can project revenue potential before placing new machines. A location offering 1,000 daily passersby at 4% conversion (40 transactions × $2.50 = $100/day) will always outperform 3,000 passersby at 2% conversion (60 transactions × $2.50 = $150/day) when you account for service burden and rent differential.
Vending machine conversion rate is the difference between operating a logistics business and running a hope-based revenue experiment. Traffic without conversion is noise. Conversion without traffic is a signal you’re in the wrong location. The intersection of both—sufficient volume meeting acceptable conversion efficiency—is where profitable machines live.
Most operators never find this intersection because they optimize for the wrong variable. They chase foot traffic counts while their conversion rate bleeds revenue into invisible inefficiency. The machines that survive aren’t in the highest-traffic locations—they’re in the locations where qualified need-state traffic converts at structural efficiency.
You don’t need more people walking past. You need more of the right people stopping. And you need to know the difference.